How to monitor your Traefik ingress with Prometheus and Grafana
Estimated time to read: 5 minutes
In this tutorial, we explain step by step how to set up Prometheus and Grafana for Traefik 2 in a Kubernetes cluster to monitor your traffic.
Monitoring your web service(s) is essential; it gives you valuable information about how the service is used, what resources are needed, and - in case of some sort of issue - will help you troubleshoot problems. Fortunately, Traefik plays nicely with the widely used open-source monitoring system Prometheus, which makes it very easy for us to create a monitoring dashboard.
Preparations
In our previous Traefik tutorial, we've set up Traefik to serve a website over HTTPS. Please follow the steps on that page if you haven't already, as this tutorial will continue from there. We assume you have set up the following:
- A Kubernetes v1.18 cluster
- The kubectl CLI tool
- Traefik 2 as an ingress controller
Step 1: Enable the metrics endpoint
Traefik has a built-in metrics endpoint that can be set up for different monitoring systems. We'll enable it for Prometheus by adding the following argument to the Traefik container configuration in traefik.yaml:
Now simply load the new configuration.
$ kubectl apply -f traefik.yaml
service/traefik unchanged
serviceaccount/traefik-ingress-controller unchanged
deployment.apps/traefik configured
You should see Prometheus enabled as the metrics backend when you visit your domain on port 8080 (the Traefik dashboard).
Also, you should see metrics when you visit the /metrics endpoint. This is the data that Prometheus will fetch.
Step 2: Set up Prometheus
We will need to tell Prometheus to fetch data from Traefik, so let's configure a so-called scrape job. Create a file called prometheus-config.yaml containing the following:
---
apiVersion: v1
data:
  prometheus.yml: |
    global:
      scrape_interval: 10s
    scrape_configs:
    - job_name: 'traefik'
      static_configs:
      - targets: ['traefik:8080']
kind: ConfigMap
metadata:
  name: prometheus-config
This tells Prometheus to poll Traefik for data every 10 seconds on port 8080. The endpoint (/metrics) is set by default, so we don't need to mention that.
The Prometheus Service will need to have a ServiceAccount and some RBAC rules set up, we'll add those in a file called prometheus-rbac.yaml.
---
apiVersion: rbac.authorization.k8s.io/v1beta1
kind: ClusterRole
metadata:
  name: prometheus
rules:
- apiGroups: [""]
  resources:
  - nodes
  - services
  - endpoints
  - pods
  verbs: ["get", "list", "watch"]
- apiGroups:
  - extensions
  resources:
  - ingresses
  verbs: ["get", "list", "watch"]

---
apiVersion: v1
kind: ServiceAccount
metadata:
  name: prometheus

---
apiVersion: rbac.authorization.k8s.io/v1beta1
kind: ClusterRoleBinding
metadata:
  name: prometheus
roleRef:
  apiGroup: rbac.authorization.k8s.io
  kind: ClusterRole
  name: prometheus
subjects:
- kind: ServiceAccount
  name: prometheus
  namespace: default
Just like we did for the Nginx service in the previous Traefik tutorial, we'll manage the Deployment and Service of Prometheus in a single file called prometheus.yaml.
---
kind: Service
apiVersion: v1
metadata:
  name: prometheus

spec:
  selector:
    app: prometheus
  type: NodePort
  ports:
  - protocol: TCP
    port: 9090
    targetPort: 9090
    nodePort: 30909

---
apiVersion: apps/v1
kind: Deployment
metadata:
  name: prometheus

spec:
  selector:
    matchLabels:
      app: prometheus
  replicas: 1
  template:
    metadata:
      labels:
        app: prometheus
    spec:
      serviceAccountName: prometheus
      containers:
      - name: prometheus
        image: prom/prometheus:v2.1.0
        ports:
        - containerPort: 9090
          name: default
        volumeMounts:
        - name: config-volume
          mountPath: /etc/prometheus
      volumes:
      - name: config-volume
        configMap:
         name: prometheus-config
Don't forget to apply the configuration.
$ kubectl apply -f prometheus-rbac.yaml
clusterrole/prometheus-config created
serviceaccount/prometheus-config created
clusterrolebinding/prometheus-config created
$ kubectl apply -f prometheus-config.yaml
configmap/prometheus-config created
$ kubectl apply -f prometheus.yaml
service/prometheus created
deployment.apps/prometheus created
Let's check if everything works as expected! First, we check if the service is running.
$ kubectl get svc
NAME         TYPE           CLUSTER-IP    EXTERNAL-IP  PORT(S)                                     AGE
kubernetes   ClusterIP      x.x.x.x       <none>       443/TCP                                     111m
prometheus   NodePort       x.x.x.x       <none>       9090:30909/TCP                              106s
traefik      LoadBalancer   x.x.x.x       x.x.x.x      80:31679/TCP,8080:30917/TCP,443:31201/TCP   77m
Execute the following command to set up port-forwarding to http://127.0.0.1:8080:
If everything works as expected, you should see the Traefik endpoint listed as a target when you click on Status > Targets (with state UP).
We're already halfway there; click on Graph, enter traefik_entrypoint_requests_total
as an expression, and hit Execute to see a graph of the total requests of each
endpoint Traefik route!
Step 3: Deploy Grafana
Grafana will use Prometheus as a data source, so we need to configure that. Create a file called grafana-config.yaml.
---
apiVersion: v1
kind: ConfigMap
metadata:
  name: grafana-datasources

data:
  prometheus.yaml: |-
    {
        "apiVersion": 1,
        "datasources": [
            {
               "access":"proxy",
                "editable": true,
                "name": "prometheus",
                "orgId": 1,
                "type": "prometheus",
                "url": "http://prometheus:9090",
                "version": 1
            }
        ]
    }
Now create a grafana.yaml file containing the Grafana Deployment and Service.
Note
that this deployment does not use a persistent volume. This means that any changes in Grafana are lost after the pod restarts.
---
apiVersion: v1
kind: Service
metadata:
  name: grafana

spec:
  selector:
    app: grafana
  type: NodePort
  ports:
    - port: 3000
      targetPort: 3000
      nodePort: 32000

---
apiVersion: apps/v1
kind: Deployment
metadata:
  name: grafana

spec:
  replicas: 1
  selector:
    matchLabels:
      app: grafana
  template:
    metadata:
      name: grafana
      labels:
        app: grafana
    spec:
      containers:
      - name: grafana
        image: grafana/grafana:latest
        ports:
        - name: grafana
          containerPort: 3000
        resources:
          limits:
            memory: "1Gi"
            cpu: "1000m"
          requests:
            memory: 500M
            cpu: "500m"
        volumeMounts:
          - mountPath: /var/lib/grafana
            name: grafana-storage
          - mountPath: /etc/grafana/provisioning/datasources
            name: grafana-datasources
            readOnly: false
      volumes:
        - name: grafana-storage
          emptyDir: {}
        - name: grafana-datasources
          configMap:
              defaultMode: 420
              name: grafana-datasources
Finally, apply the configuration, and you should have a monitoring dashboard!
$ kubectl apply -f grafana-config.yaml
configmap/grafana-datasources created
$ kubectl apply -f grafana.yaml
service/grafana created
deployment.apps/grafana created
Just like before, you should be able to use port-forwarding to access Grafana. The default login credentials are admin/admin.
To visualize metrics in Grafana you will need to add Grafana dashboards. You can either create your own dashboard or import ready-made dashboard from online sources like grafana.com.
To import a Grafana dashboard with support for Traefik metrics visit your Grafana instance at http://127.0.0.1:3001/dashboard/import and load the following URL which points to a community created dashboard: https://grafana.com/grafana/dashboards/4475
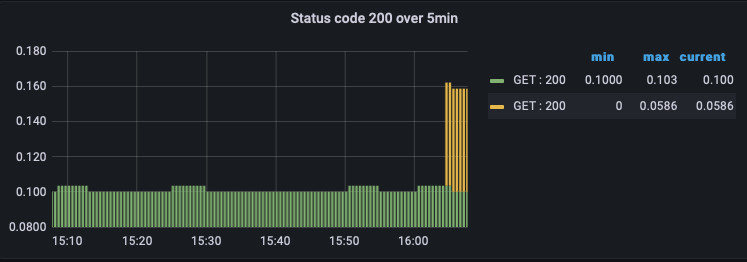
After following the dashboard instructions you be presented with some pretty Traefik graphs:
What's next?
There are a couple of important things which need to be done.
- Add an IngressRoute just like the one that's defined in
nginx-ingressroute.yaml(see the previous tutorial). You obviously don't want to use port-forwarding to access Grafana. - Add a persistent volume to the Grafana deployment to keep dashboards and other changes.
- It would be neater if both Prometheus and Grafana were deployed in a separate "monitoring" namespace.
- Add more scraper jobs! Monitoring the Kubernetes cluster itself would be a good idea to implement.