Getting started with EMK
Estimated time to read: 3 minutes
This page will show you around the functions of the enterprise-managed-kubernetes dashboard within Fuga Cloud.
Prerequisites:
- Fuga Cloud Account
Overview:
- Create a Kubernetes Cluster
- EMK Cluster overview
- EMK Cluster details
The dashboard
The first part is getting to the EMK dashboard.
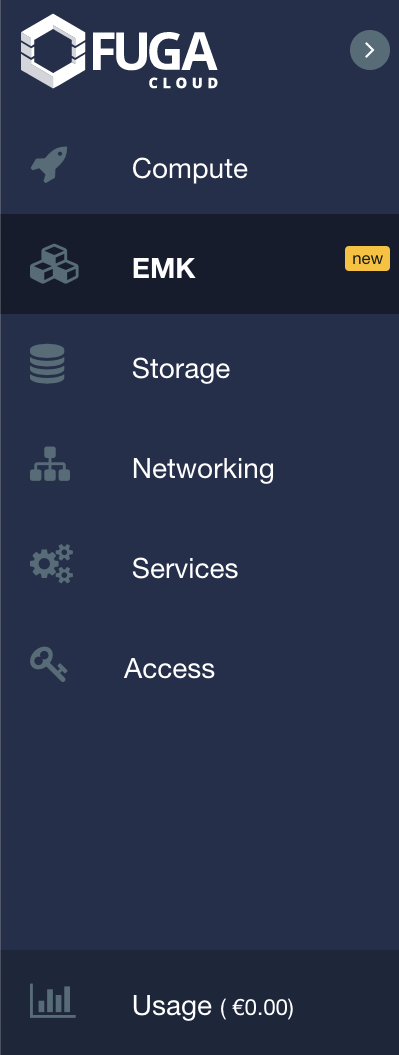
From the Fuga Dashboard you can find in the left sidebar the EMK service, click there on "EMK".
Opening the EMK view:
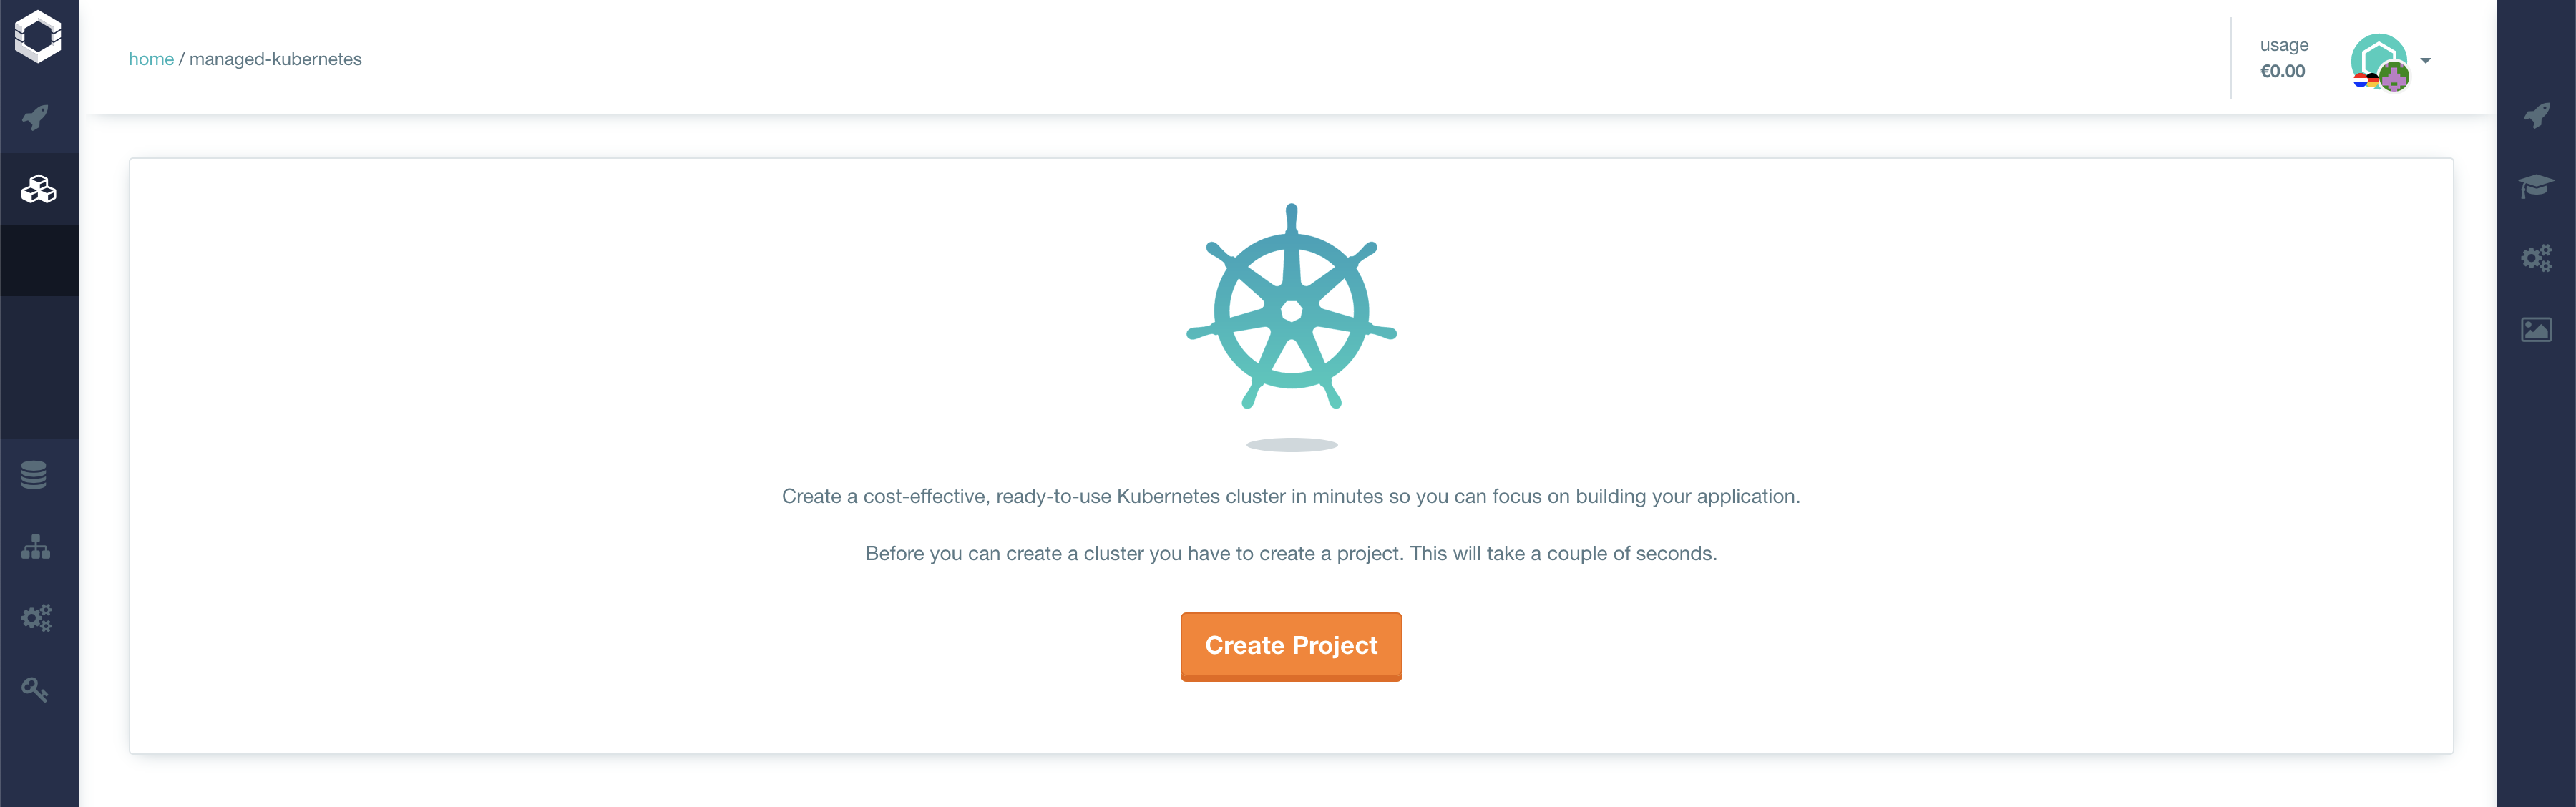
Opening the EMK view will give you a window for the first time where it creates your environment on our platform. When that is finished you will get a nice EMK overview.
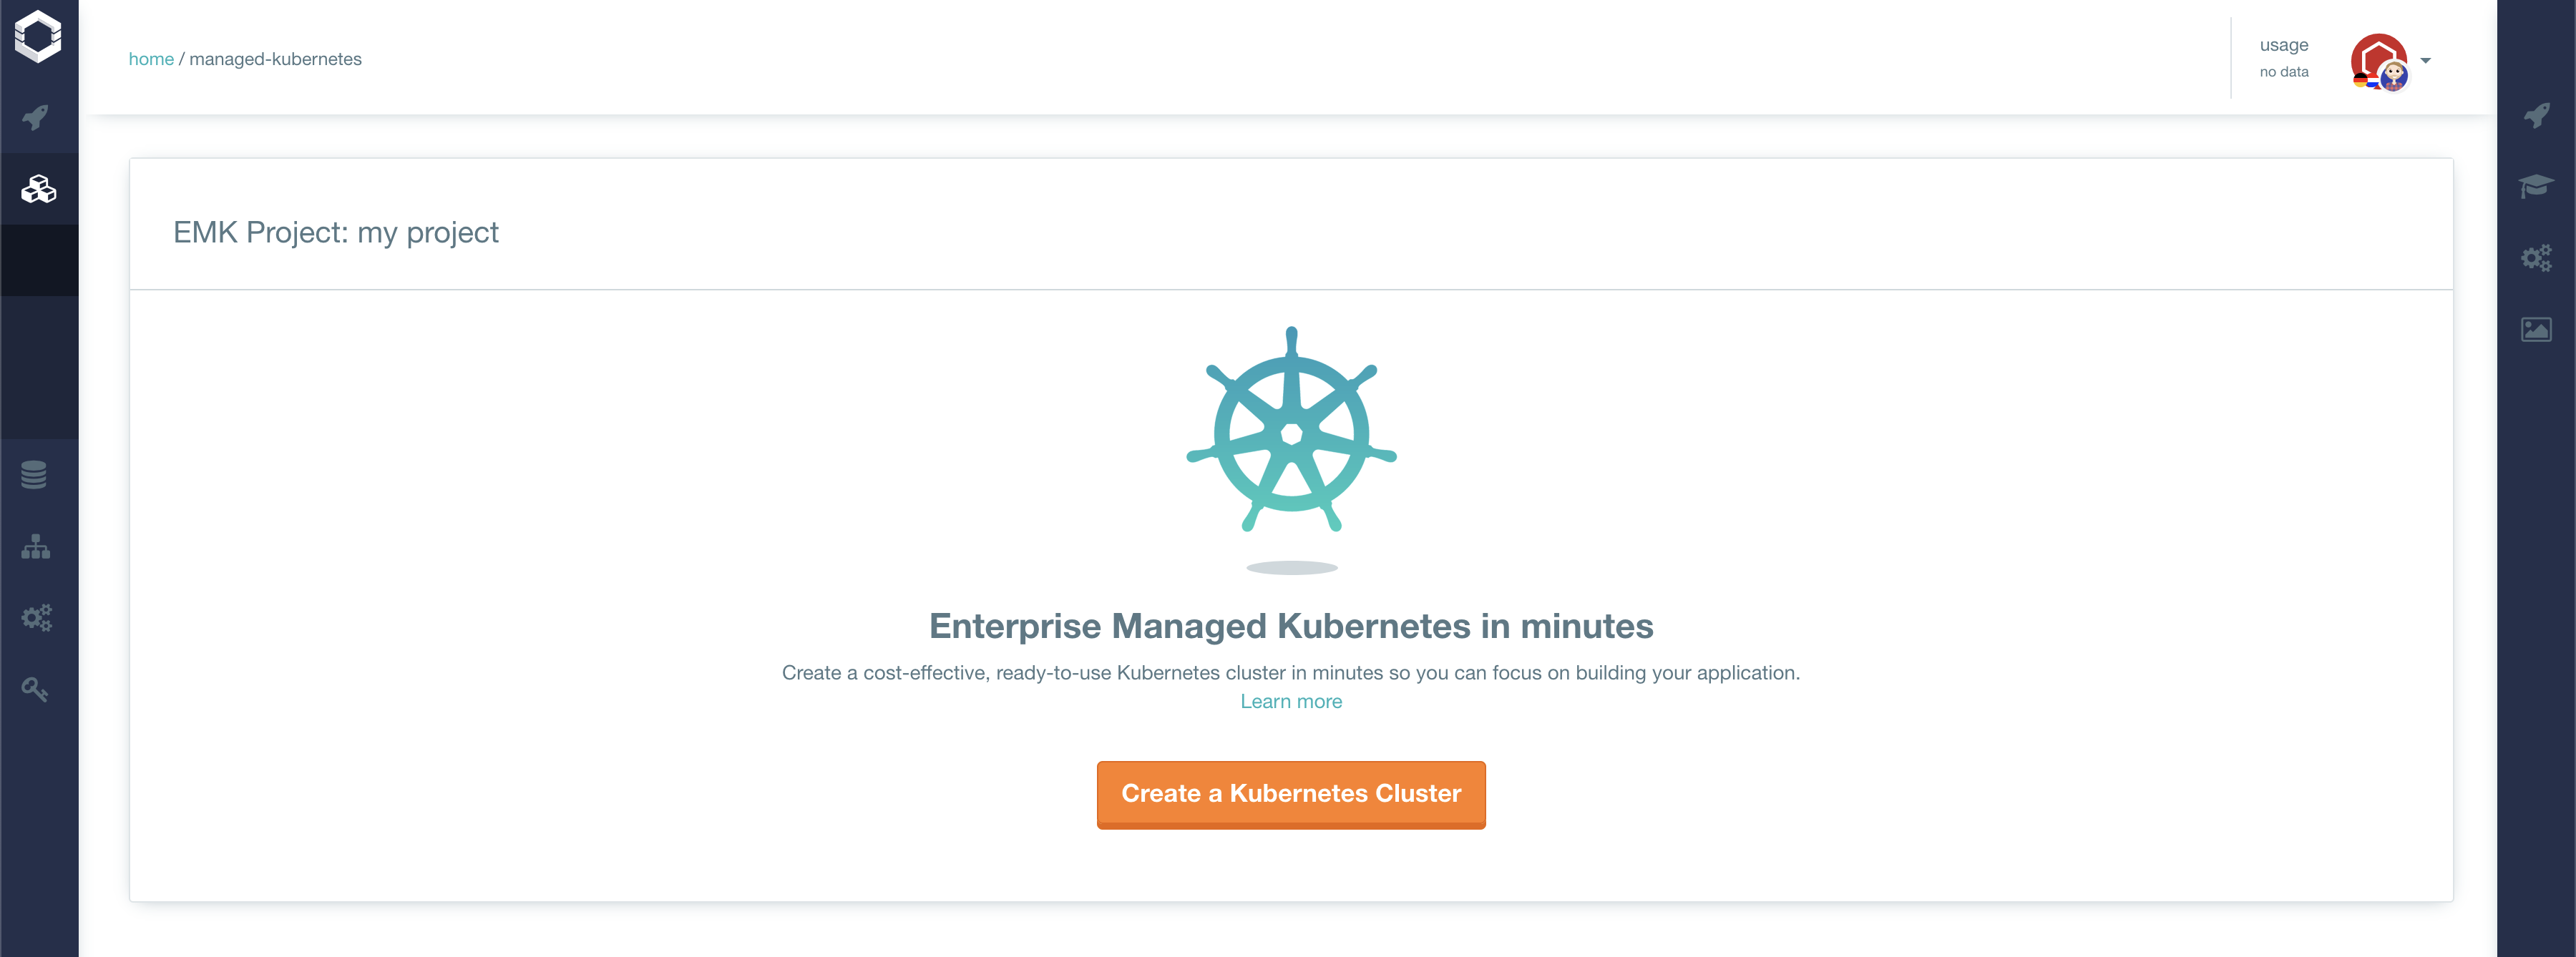
Here you can create an one click Kubernetes cluster or configure one to your flavor. In the left top corner you will find the name for your EMK Project.
Here you will find the first screen to create an EMK Project.
When you create an EMK Project you will be shown with the create cluster page.
Creating a Managed Kubernetes Cluster
See provisioning a Kubernetes cluster for creating a cluster.
The EMK Cluster overview:
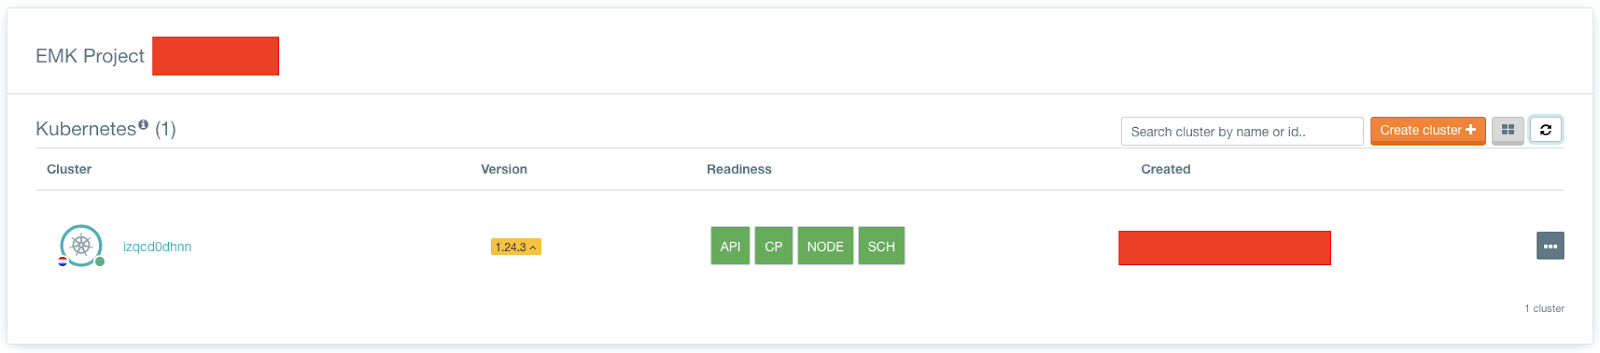
When you have created your cluster, you will find it in the EMK Cluster overview. From this point you can start various actions:
- See the details of your cluster by clicking on the name
-
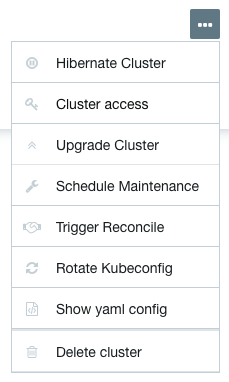
Click the “...”
- Hibernate your cluster
-
Cluster access
Get your kubeconfig
-
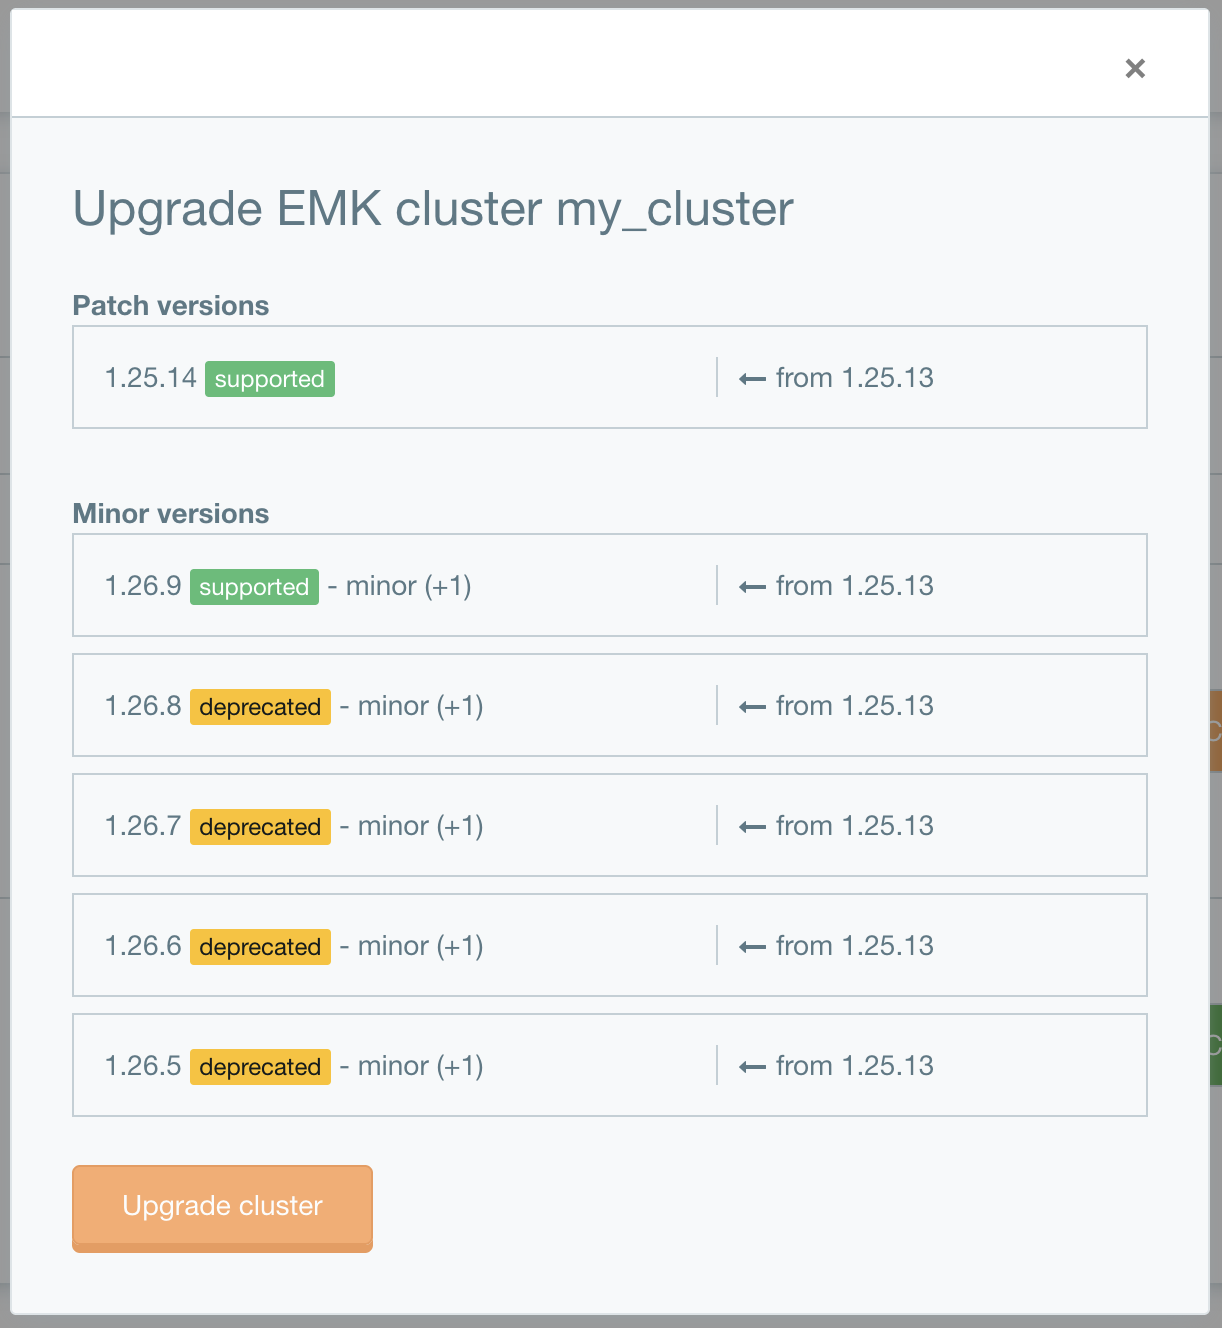
Upgrade your cluster
- Schedule maintenance
- Trigger reconcile
- Rotate kubeconfig
- Show the yaml configuration of your cluster
- Delete your cluster
In this cluster overview example there is one cluster. I have created one that has the possibility to upgrade. That’s why there is a “^” behind the version and it is orange. If there is a minor upgrade possible it will show two “^^”. Clicking those “^^” will give the option to upgrade your cluster to a higher version.
Danger
Make sure your workload can run on the next version of Kubernetes!
EMK Cluster details
To get here, you go to the EMK Cluster overview and click on the name of one of your clusters. In this overview you see 4 different blocks.
- Specifications of your cluster
- The worker pools of your cluster
- The infrastructure of your cluster
- Logging and monitoring of your cluster
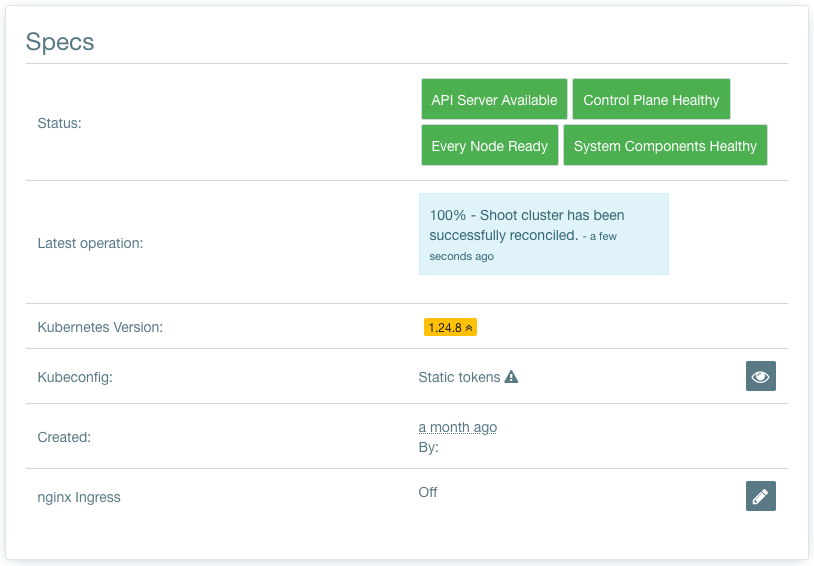
Cluster specification
Here you can find the status of your cluster, the Kubernetes version and your kubeconfig.
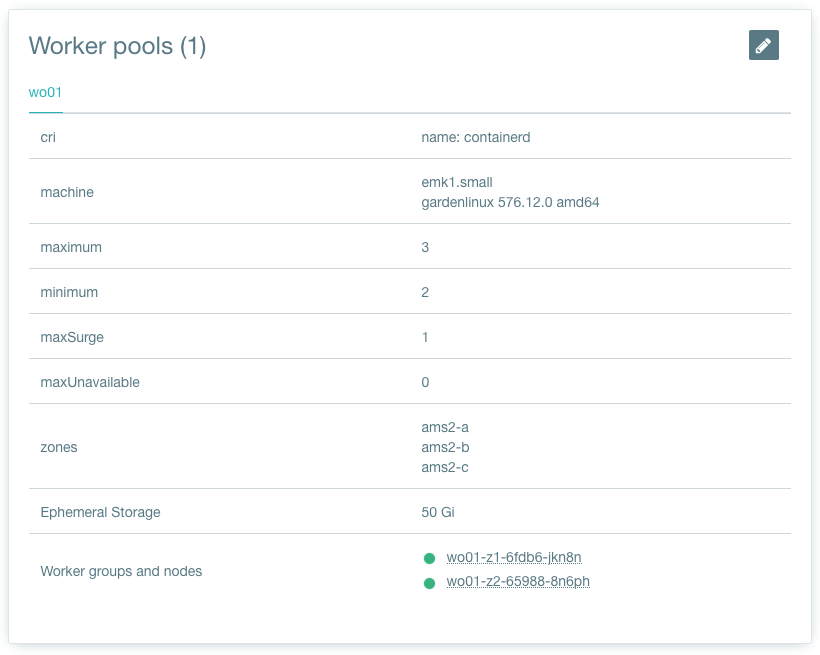
Worker pools
Here you can view and create worker pools. In the worker pool you can find: container runtime interface (cri), machine type (Instance flavor), minimum nodes, maximum nodes, max surge of nodes at a time, the availability zones and how big each node ephemeral storage is.
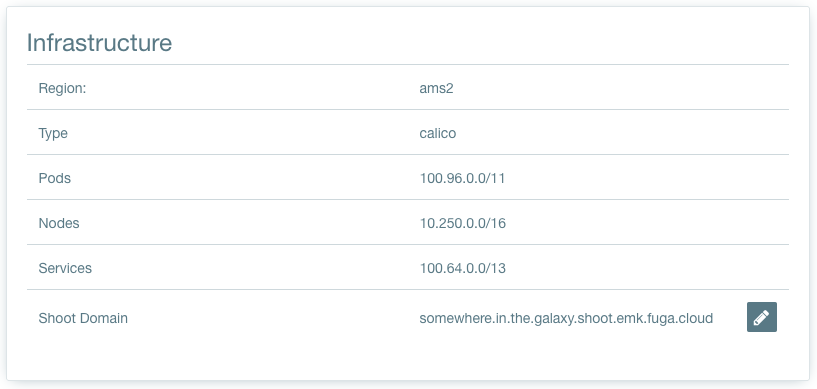
Infrastructure
Here you can find: the region where the cluster is deployed, the network type, various network CIDR’s and the shoot domain.
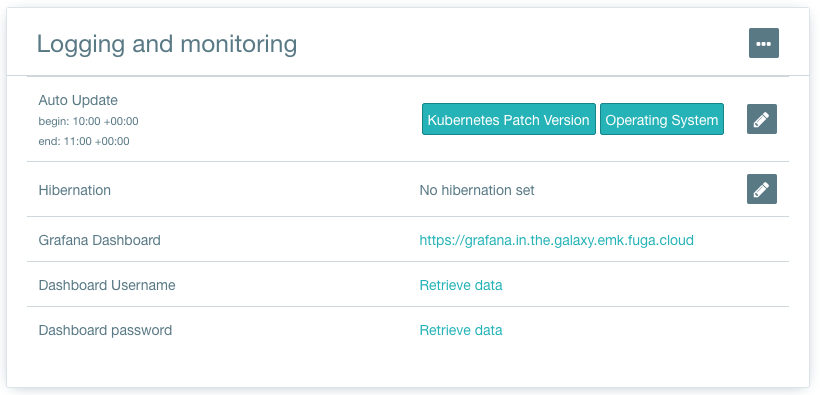
Logging and monitoring
Here you can find the maintenance window, hibernation window and the Grafana dashboard to see the statistics of your cluster.
Final word
In this walkthrough you have learned where to find what in the Fuga Dashboard, how to create a k8s cluster and see all the configuration details of the cluster. To access your cluster see our documentation here: How to access my EMK Cluster